Your graphics add a nice touch to my presentations and I recently used them for one of my all-hands meetings. Your toolbox adds professionalism to my slides. Instead of using standard clipart.
Claude Jones, Director of Engineer, @Walmartlabs, USA
Your graphics add a nice touch to my presentations and I recently used them for one of my all-hands meetings. Your toolbox adds professionalism to my slides. Instead of using standard clipart.
Claude Jones, Director of Engineer, @Walmartlabs, USA
I needed a fresh look at some of my slides. I've tried to find a way to create a paintbrush effect, to underline, accentuate, add some color and the handwritten markers were just the things. Very easy to use, easy to size, change the color. It was an affordable, perfect solution and I'm happy to recommend it.
Anonymous, US
The crisp, clean look of the graphics, and the fact that it allowed me to easily edit and change the colors to match the template was my main reason for purchasing them.
Brandie Jenkins, E-learning Developer, USA
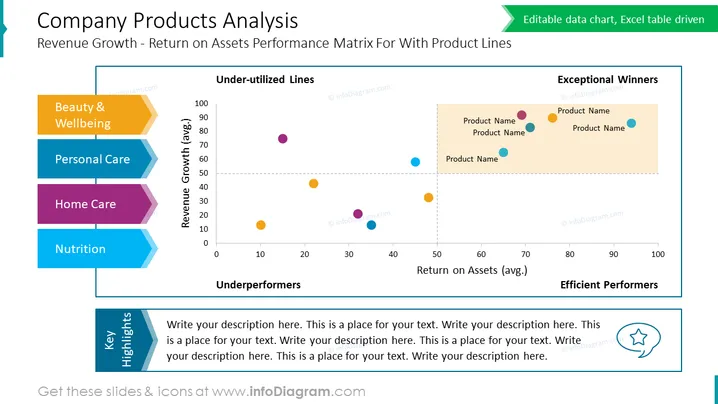
The PowerPoint slide titled "Company Products Analysis" visualizes a company's product lines against two financial performance metrics: revenue growth and return on assets. The slide categorizes products into four segments represented by colored bubbles: "Exceptional Winners," "Efficient Performers," "Underperformers," and "Under-utilized Lines." Details of product names are placed next to corresponding bubbles. A sidebar categorizes product lines into "Beauty & Wellbeing," "Personal Care," "Home Care," and "Nutrition," which likely align with the color-coded bubbles on the graph. A section titled "Key Highlights" is reserved for textual analysis, presumably to offer insights or commentary on the data presented in the graph.
The slide design is clean and professional, using a limited color palette to clearly distinguish data points and categories. It effectively combines graphical elements such as scatter plot, color-coded legends, and text sections to present a multi-dimensional analysis.


