Financial Decks
Visualize your results with ease
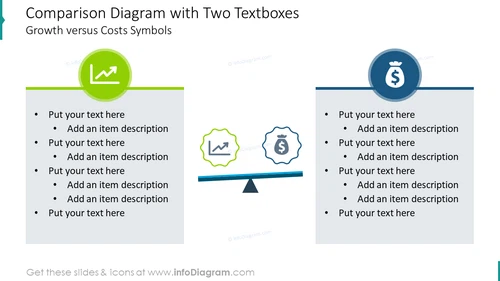
Comparison diagram with two textboxes: growth versus costs
from deck
Modern Flat Diagrams - Ultimate Bundle for Visual Presentations (PPT graphics)
Info
Comparison Diagram with Two Textboxes
Slide Content
The slide is titled "Comparison Diagram with Two Textboxes" which suggests a tool for juxtaposing two different elements, in this case, "Growth versus Costs Symbols". Each side of the comparison has a colored textbox with placeholder text ("Put your text here" and "Add an item description"), representing points for expansion on the concept it symbolizes. The left side is linked to growth, indicated by an upward arrow in a green circle, suggesting positive trends or financial increase. Conversely, the right side represents costs, with a dollar sign encapsulated in a blue circle, denoting financial expenditures or investments.
Graphical Look
- Two large, rounded text boxes divided by a central balance-like graphic.
- The left textbox is green; the right one is blue, each containing bullet points with placeholder text.
- Above the left textbox, there is a green circle with a white upward-trending graph icon symbolizing growth.
- Above the right textbox, a blue circle with a white dollar sign symbolizes costs.
- The balance graphic between the boxes has a horizontal blue beam and a grey triangle beneath, suggesting a weighing scale.
- Icons within jagged shapes sit on the central beam, denoting a comparison between the two concepts.
The slide employs a clean and modern design with a clear visual distinction between the two compared categories. Its symmetrical layout and contrasting colors aid in delivering a clear comparative message.
Use Cases
- To explain financial strategies by contrasting investment plans with their potential returns.
- To showcase product features versus cost implications in a Business-to-Business (B2B) sales presentation.
- In a budget meeting to weigh the benefits of different departments against their running costs.
- During a project review, to compare the progress made and milestones achieved with the resources expended.


