Financial Decks
Visualize your results with ease
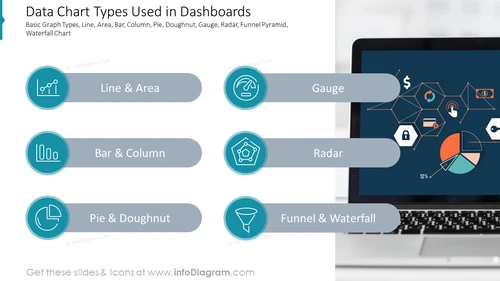
Data Chart Types Used in Dashboards
from deck
Dashboard Layouts for Executive Data Report Presentation (PPT Template)
Info
Data Chart Types Used in Dashboards Slide Description
The slide presents all types of charts used in the Dashboard Layouts for Executive Data Report Presentation Template. Every chart type (Line & Area, Bar & Column, Pie & Doughnut, Gauge, Radar, Funnel & Waterfall) is illustrated with an adequate icon. The list of charts can be expanded. The whole slide is fully editable in PowerPoint.
Data Chart Types Used in Dashboards Slide Contains:
The slide contains the list of different graph types used in the whole deck:
- Line & Area charts
- Bar & Column charts
- Pie & Doughnut charts
- Gauge charts
- Radar charts
- Funnel & Waterfall charts
The slide is enriched with icons and a picture which are fully editable in PowerPoint.


