Financial Decks
Visualize your results with ease
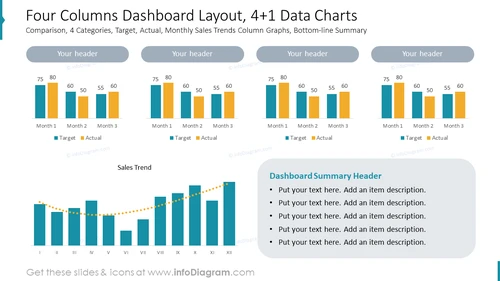
Four Columns Dashboard Layout, 4+1 Data Charts
from deck
Dashboard Layouts for Executive Data Report Presentation (PPT Template)
Info
Four Columns Dashboard Layout, 4+1 Data Charts
Slide Content
The PowerPoint slide depicts a dashboard layout meant for comparing data across four categories, showing both target and actual figures in monthly trends. There are four sets of column graphs labeled 'Your header', each representing a category with data for 'Month 1', 'Month 2', and 'Month 3'. Each graph contrasts 'Target' and 'Actual' figures. Below, there's a 'Sales Trend' line chart with twelve points, indicating monthly performance. To the right is a 'Dashboard Summary Header' section with bullet points for additional text.
Graphical Look
- The title of the slide is prominently displayed at the top and is highlighted by a subtle, decorative sidebar.
- Four rounded-rectangle placeholders with the text "Your header" suggest areas to customize with specific category names.
- Each category is represented by a group of two-colored bar graphs showing 'Target' versus 'Actual' performance.
- Bar graphs use a blue hue for 'Target' and an orange hue for 'Actual', making the distinction clear.
- A horizontal line chart labeled 'Sales Trend' underneath the bar graphs showcases performance over twelve months, shown as Roman numerals.
- The line chart includes a dot-dash style line connecting blue bars, with orange dots highlighting individual data points.
- A rectangular text box with a rounded lower left corner is positioned to the right of the slide for a dashboard summary.
The slide uses a balanced mix of colors and designated areas for text and graphical data representation. The graphical elements are clear, clean, and professionally rendered, leading to a highly readable and effective design.
Use Cases
- Presenting monthly sales reports to compare actual performance against set targets.
- Offering a visual summary of performance metrics during business review meetings.
- Customizing the dashboard for department-specific presentations, such as marketing or finance updates.
- Using as a template in quarterly or annual business performance reviews to highlight key achievements and areas of improvement.


