Financial Decks
Visualize your results with ease
Key performance indicators outline graphics with short description
from deck
Product Company Sales Presentation (PPT Template)
Info
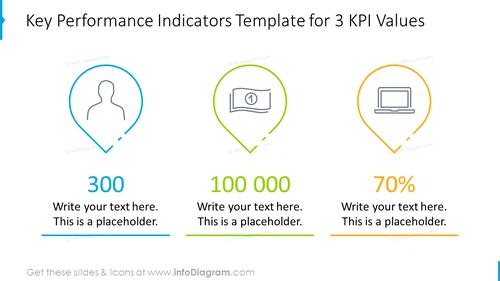
Key Performance Indicators Template for 3 KPI Values
Slide Content:
The slide is designed to present three key performance indicators (KPIs) in a visually appealing format. Each KPI is symbolized by an icon: a person, a calendar, and a laptop, suggesting metrics related to human resources, time management, and technology or productivity. Below each icon is a space to showcase a numeric value or percentage that represents the KPI, along with placeholder text for additional descriptions or context.
Graphical Look:
- Three distinct icons each within a pin-shaped bubble: a human figure, a calendar page, and a laptop.
- The icons are color-coded with blue, green, and yellow outlines, adding to the visual distinction.
- Large, bold numbers "300," "100 000," and "70%" are displayed beneath the respective icons, indicating KPI values.
- Under each number, there is a blue horizontal line that functions as a placeholder for further text.
- The background of the slide is white, which helps the colors and icons stand out. The slide has a simple, modern design with a clear focus on the KPI values. The use of different colors and icons aids in quickly differentiating between the various metrics.
Use Cases:
- In business review meetings to report on company performance against set objectives.
- During strategic planning sessions to define and discuss targets for different company departments.
- In investor presentations to highlight the company's operational efficiency and performance.
- For internal dashboards that track and display ongoing performance metrics.


