Financial Decks
Visualize your results with ease
Modifying shapes in PowerPoint
from deck
Dashboard Layouts for Executive Data Report Presentation (PPT Template)
Info
Modifying shapes in PowerPoint
Slide Content
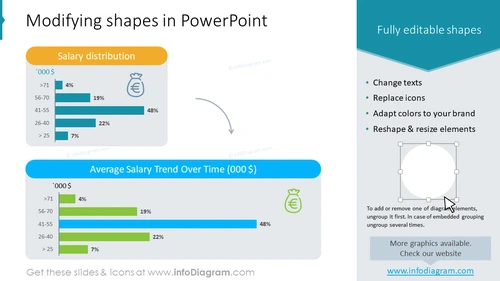
The slide is divided into two sections illustrating the concept of "Modifying shapes in PowerPoint" with a focus on "Fully editable shapes". In the left section, there's a case study titled "Salary distribution" showing a bar chart with salary ranges and the percentage they represent in a certain context. The chart indicates the majority of salaries fall within the "41-55" range at "48%". The right section lists benefits of fully editable shapes such as the ability to "Change texts", "Replace icons", "Adapt colors to your brand", and "Reshape & resize elements", suggesting that the shapes can be customized for various presentation needs, with an example of a resizable circle shape beneath.
Graphical Look
- The slide background is white with a subtle cyan gradient on the top border.
- A large header in dark teal with white text reads "Modifying shapes in PowerPoint".
- Two rounded rectangle blocks—one orange and one blue—sit opposite each other with slide content.
- The left block includes a bar graph under the "Salary distribution" heading, with bars in various shades of blue representing salary ranges.
- Icons of a money bag with a Euro sign are next to the salary categories on the left block.
- The right block contains a bulleted list of text and an illustration of a shape with resizing handles, indicating interactivity.
- A grey arrow pointing from the left block to the right one symbolizes the modification process.
- Small text and logos are near the bottom of the slide, but these are not to be detailed.
The overall look is clean, with a balance between a data display on the left and descriptive text with an illustrative example on the right. It uses contrasting colors for visual separation and emphasis.
Use Cases
- Presenting editable features of a software tool during a training or sales demo.
- Highlighting the capabilities of a presentation design service in a marketing pitch.
- Explaining data visualization customization options in a workshop or educational setting.
- Illustrating the flexibility of a product's user interface during a product development meeting.


