Financial Decks
Visualize your results with ease
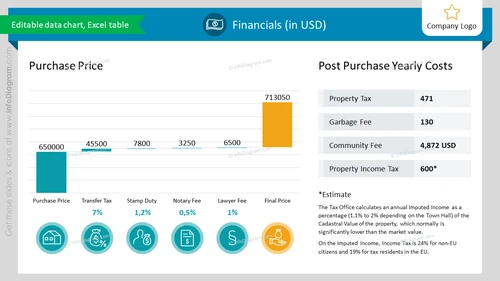
Property Pricing Development Chart With Cost Breakdown Specification of Property Tax, Real Estate Sale Fees
from deck
Real Estate Property Presentation (PPT Template)
Info
Editable data chart, Excel table
Slide Content
The slide presents financial data related to property acquisition and upkeep costs in USD. The left section of the slide, titled "Purchase Price," shows a bar chart with costs such as Purchase Price, Transfer Tax (7%), Stamp Duty (1.2%), Notary Fee (0.5%), Lawyer Fee (1%), and the Final Price, accompanied by graphical icons representing each cost. The right section, "Post Purchase Yearly Costs," lists ongoing expenses including Property Tax, Garbage Fee, Community Fee, and Property Income Tax, with an asterisk indicating an estimate for the latter.
Graphical Look
- The slide background is white with a subtle grid pattern.
- The top of the slide features a header with a light blue background.
- The slide is divided into two main sections: "Purchase Price" on the left and "Post Purchase Yearly Costs" on the right.
- There is a bar chart in the "Purchase Price" section with bars in teal and orange colors representing different costs.
- Each cost item in the "Purchase Price" section is associated with a circle icon and percentage text.
- The icons are teal with white symbols: a house for Purchase Price, percentage signs for taxes and fees, a notary stamp, and a scale for Lawyer Fee.
- The "Post Purchase Yearly Costs" section has four grey boxes aligned vertically, containing the cost types and corresponding amounts.
- A footnote section at the bottom provides additional information about the "Property Income Tax" estimate.
- Text throughout the slide uses varying fonts and weights for hierarchy, with darker text for headers and lighter texts for details.
The slide has a balanced, professional layout with a clear division between initial costs and ongoing costs. The use of icons helps to visualize the different fees and taxes, making the data more accessible.
Use Cases
- To present a financial breakdown for real estate investments during a business meeting.
- In a real estate company's presentation to clients to illustrate the costs associated with purchasing a property.
- During a financial planning or budgeting session to discuss and analyze property-related expenses.
- For educational purposes, in seminars or classes explaining the financial aspects of buying and maintaining real estate.


