Your graphics add a nice touch to my presentations and I recently used them for one of my all-hands meetings. Your toolbox adds professionalism to my slides. Instead of using standard clipart.
Claude Jones, Director of Engineer, @Walmartlabs, USA
Your graphics add a nice touch to my presentations and I recently used them for one of my all-hands meetings. Your toolbox adds professionalism to my slides. Instead of using standard clipart.
Claude Jones, Director of Engineer, @Walmartlabs, USA
I needed a fresh look at some of my slides. I've tried to find a way to create a paintbrush effect, to underline, accentuate, add some color and the handwritten markers were just the things. Very easy to use, easy to size, change the color. It was an affordable, perfect solution and I'm happy to recommend it.
Anonymous, US
The crisp, clean look of the graphics, and the fact that it allowed me to easily edit and change the colors to match the template was my main reason for purchasing them.
Brandie Jenkins, E-learning Developer, USA
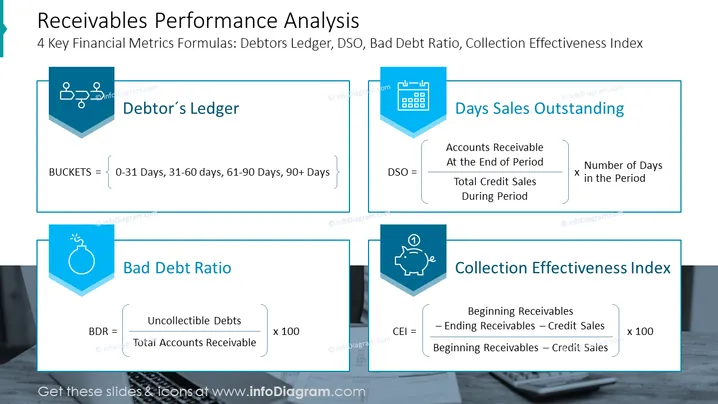
This PowerPoint slide discusses 'Receivables Performance Analysis' by presenting 4 key financial metrics formulas related to managing and analyzing receivables in a business context. The metrics include:
This PowerPoint slide titled 'Receivables Performance Analysis' effectively lays out 4 Key Financial Metrics Formulas, vital for evaluating the performance of receivables within a business. Debtor’s Ledger is a categorization tool splitting receivables by age, helping businesses monitor collection timelines. Days Sales Outstanding (DSO) quantifies the average length of time receivables remain uncollected, revealing the efficiency of credit sales collection. Bad Debt Ratio (BDR) assesses the potential loss from uncollectible accounts, serving as a risk indicator. Lastly, the Collection Effectiveness Index (CEI) offers insight into the actual collection performance relative to the amount of receivables available during a given period.
The visual composition is clean and well-structured, ensuring easy readability. The use of icons and color coding effectively distinguishes each financial metric for quick reference.




