Financial Decks
Visualize your results with ease
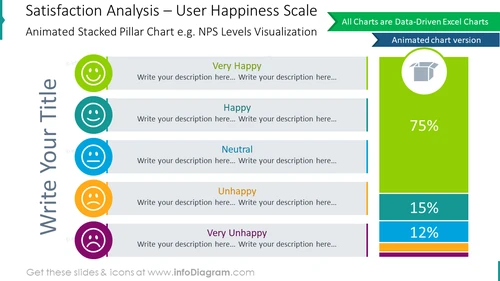
Satisfaction analysis showing user happiness scale
from deck
Bar and Column Chart Data-driven Graphics (PPT Template)
Info
Satisfaction Analysis Showing User Happiness Scale Infographic
Use this colorful user happiness scale to present the satisfaction analysis. This slide contains a fully editable animated stacked pillar Excel data-driven chart. Describe the results using the scale from very unhappy to neutral to happy. Example usage: NSP levels visualization.
What Does This Satisfaction Analysis Showing User Happiness Scale Infographic Include?
- Editable Excel data-driven animated stacked pillar chart
- 5 gray text containers with titles and illustrations for your scale descriptions
- A flat icon of a box, product
- Outline icons of a sad face, worried face, neutral face, happy face, and delighted face
This Satisfaction Analysis Showing User Happiness Scale Infographic is a part of our Bar and Column Chart Data-driven Graphics PPT Template.


