Financial Decks
Visualize your results with ease
Transparent 3-dimensional cube layout for 3 levels
from deck
Modern Flat Diagrams - Ultimate Bundle for Visual Presentations (PPT graphics)
Info
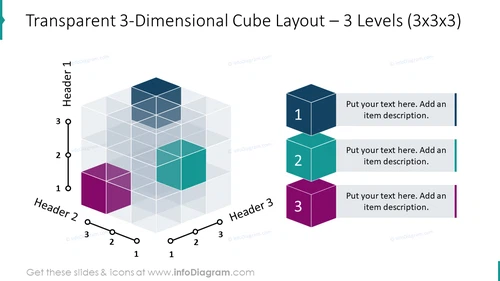
Transparent 3-Dimensional Cube Layout – 3 Levels (3x3x3)
Slide Content
The slide presents a 3-dimensional cube layout with 3 levels, each level composed of 3x3 smaller cubes, totaling 27 units. It's designed for categorizing items or concepts in a structured manner, with three primary categories (Header 1, Header 2, Header 3) and sub-levels within each. Each large cube represents a main category with an option to add descriptive text. The smaller cubes can represent distinct elements or ideas that relate to the main category, allowing a presentation of complex information in a highly organized and visually appealing format.
Graphical Look
- The slide features a large, semi-transparent, 3D cube graphic on the left, composed of smaller cube segments.
- There are three distinct larger cubes, labeled 1, 2, and 3, that are colored in blue, green, and purple, respectively.
- Each larger cube is associated with an adjacent text box for adding descriptions, all aligned to the right.
- Each larger cube's number is prominently displayed in white against its color, illustrating hierarchy or progression.
- The overall 3D cube structure uses shades of grey to distinguish the levels and provide a sense of depth.
- The cube layout is overlaid with axes (labeled Header 1, Header 2, and Header 3), which use a combination of solid lines and dots to indicate different levels along each axis.
- The background of the slide is white, highlighting the vivid colors and contrast of the graphical elements.
The slide is clean and modern, with a strong emphasis on 3D graphical elements to visually delineate different segments. The use of transparency and color coding makes it easy to differentiate between the categories and subcategories, providing a clear and structured format for conveying information.
Use Cases
- To illustrate a multi-level project breakdown in project management presentations.
- For categorizing research data and findings in academic or scientific presentations, with each axis representing a different dimension of the research.
- In marketing strategy presentations to present segmentation, targeting, and positioning within markets.
- As a visual aid in business strategy meetings to discuss the relationship between various products, services, or business units and their priorities or performance levels.


