Financial Decks
Visualize your results with ease
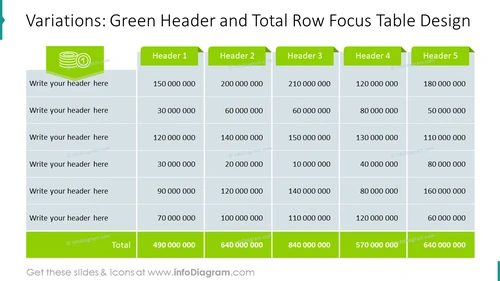
Variations: Green Header and Total Row Focus Table Design
from deck
Creative Tables Graphics (PPT template)
Info
Variations: Green Header and Total Row Focus Table Design
Slide Content: The slide showcases a table designed to highlight information using a green header for column titles such as "Header 1" to "Header 5" and a total row at the bottom. Each header likely represents a different category or metric to be filled out by the presenter. The table rows seem to be placeholders for additional headers and corresponding numerical data, with the bottom row calculating totals across the columns, demonstrating the sum of numerical data entered above.
Graphical Look:
- The slide's background is white, providing a clean and neutral canvas for the content.
- A prominent turquoise bookmark-ribbon shape is placed on the left side of the slide.
- The slide title is in bold, large font, colored in dark grey, aligning centrally at the top.
- The table headers are in a bold, sans-serif font, displayed on bright green banner-shaped backgrounds with a slight fold effect on the right edge, suggesting depth.
- Each header has an icon placed to the left inside a white circle with a fine green border, adding a visual element to the headers.
- The table cells have a thin grey border, enhancing the grid's visibility and structure.
- The content within the cells is in a lighter shade of grey, differentiating it from the slide title and header banners.
- The total row is highlighted with a green background similar to the header banners, drawing attention to the summary figures.
- The footer contains a muted watermark of a URL for the source of the slides.
The overall look of the slide is modern and business-centric with a distinct color theme for focus elements. The green highlights guide the viewer's attention to headers and totals, creating a strong visual hierarchy.
Use Cases:
- To present financial summaries or budget allocations during business meetings.
- For comparing quarterly sales data across different product categories.
- In educational settings to teach data organization and how to highlight important figures.
- As a template in corporate documents for reportingand analysis, where consistency in style is required.


