Your graphics add a nice touch to my presentations and I recently used them for one of my all-hands meetings. Your toolbox adds professionalism to my slides. Instead of using standard clipart.
Claude Jones, Director of Engineer, @Walmartlabs, USA

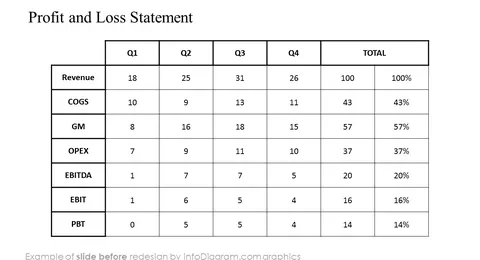
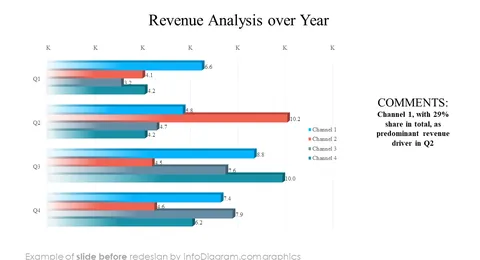
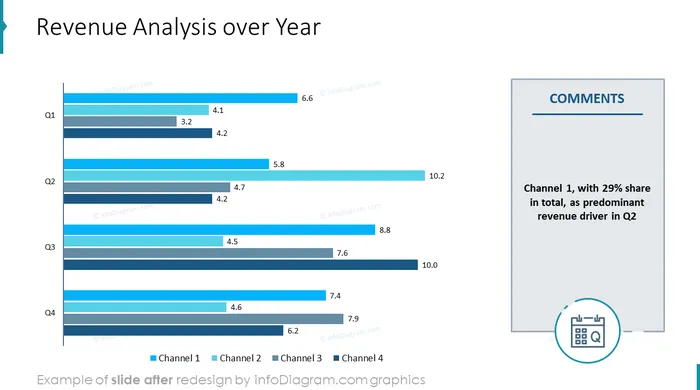
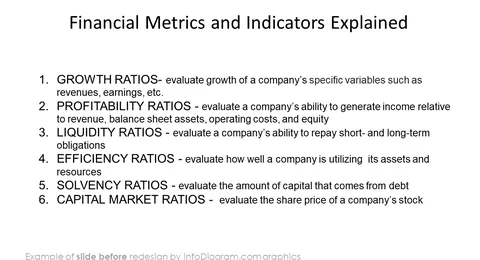
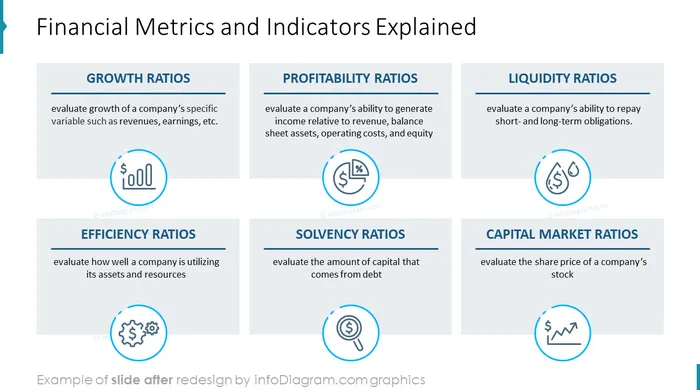
Before and after
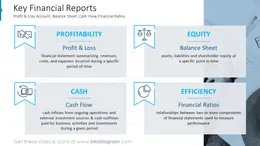
Financial reports may be difficult to understand by non-financial audiences. Create an engaging financial presentation of your organization's business performance with a professional PowerPoint template. You can reuse our data charts and tailor them to your needs to upgrade your presentation slides. The charts are data-driven Excel objects, so it is very easy to change the data values. Talk about financial performance topics including income statements , balance sheets , or cash flow in an eye-catching and attractive format. Use this template with pre-designed, content-ready slides, and modify them to your needs. Leave the design elements to the professionals and enjoy saving time with your presentations.
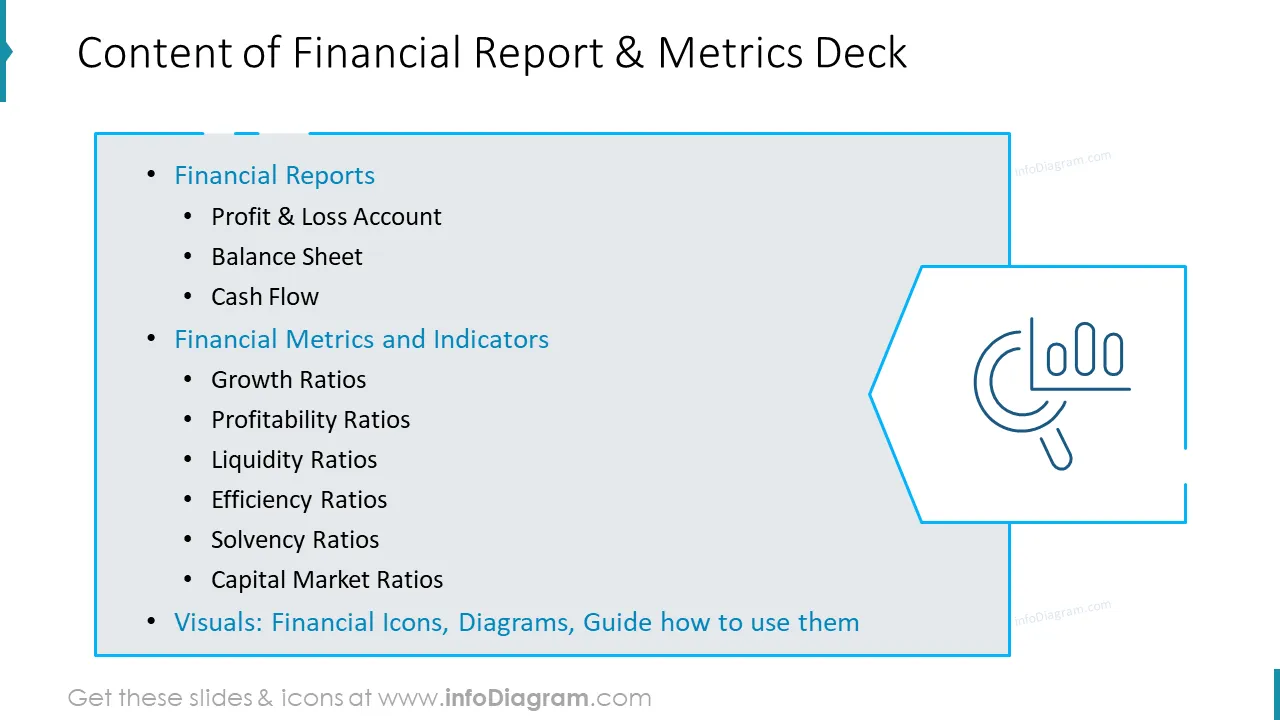
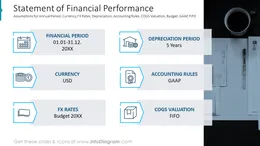
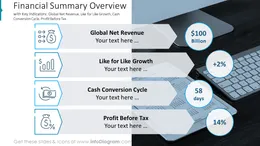
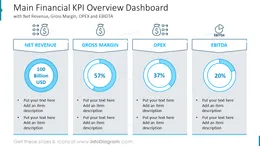
Financial Report PowerPoint Template contains slides with financial topics and KPIs:
Format: Fully editable vector shapes and fonts. (You can recolor infographics, diagrams, and icons. It is also possible to resize elements without quality loss).
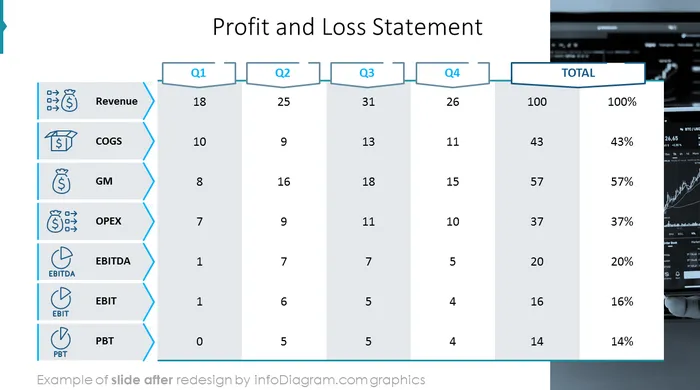
A financial report (also known as a financial statement or finance report) is a management tool used to communicate key financial information to both internal and external stakeholders by covering every aspect of financial affairs with the help of specific KPIs. Financial statements are often audited by government agencies, accountants, firms, etc. to ensure accuracy and for tax, financing, or investing purposes. Financial statements include profit & loss accounts, balance sheets, and cash flow statements. Relevant indicators are usually inspected during annual financial reports to understand the financial position of the company or investigate financial KPI values like net income. In this context, the financial report template is an easy-to-edit presentation template for your weekly financial reports, monthly reports, or annual reports to present core financial activities.
Financial reports full of data and analysis are typically difficult to digest by non-financial audiences. If you want to disclose your quarterly or annual numbers simply and understandably to your key stakeholders use our templates that will help you to present them in an eye-catching and attractive format.
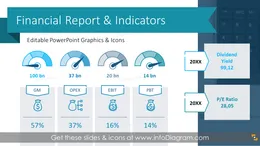
You can reuse our graphs and charts and tailor them to your needs to upgrade your presentation slides. The majority of our charts are Data-Driven Excel Charts, so it is very easy to change the presented values. We also include detailed instructions on how to alter the content, values, colors, and look and feel of the charts.
The template is easy to edit. So, after you buy this template, you can immediately download and change the data according to your needs. You can edit your presentation using Microsoft PowerPoint, Google Slides, or other presentation software. Copy and paste the contents using shortcuts or dragging the PowerPoint template to adapt it to your presentation topic. The slides and visuals are professionally designed and the content is very easy to customize. If you have creative ideas and want a unique look, play around with the elements and make the design your own with a personal touch!
Using infographics in your presentation will help you organize information. Your numbers and comparisons will be compelling, and easy to understand. The PPT template comes with a multitude of use cases. You can use this financial report template as an income statement template, a simple balance sheet template, an annual financial report template, or as a guideline for financial health to brief your team.
Try using those PowerPoint illustrations to present your content visually in an elegant way.
All graphics are editable, so you can modify the colors and text. We also added a general icon collection at the end of the presentation deck. Optionally you can also extend the collection by more PPT symbols (see Related Diagrams section).
Fully editable in PowerPoint set of vector shapes fully editable by using built-in PowerPoint tools, including
Check out our Quick Guide to fully utilize your Financial Report Template.
Check out our blog and YouTube video:
Your graphics add a nice touch to my presentations and I recently used them for one of my all-hands meetings. Your toolbox adds professionalism to my slides. Instead of using standard clipart.
Claude Jones, Director of Engineer, @Walmartlabs, USA
I needed a fresh look at some of my slides. I've tried to find a way to create a paintbrush effect, to underline, accentuate, add some color and the handwritten markers were just the things. Very easy to use, easy to size, change the color. It was an affordable, perfect solution and I'm happy to recommend it.
Anonymous, US
The crisp, clean look of the graphics, and the fact that it allowed me to easily edit and change the colors to match the template was my main reason for purchasing them.
Brandie Jenkins, E-learning Developer, USA


You may also need