Your graphics add a nice touch to my presentations and I recently used them for one of my all-hands meetings. Your toolbox adds professionalism to my slides. Instead of using standard clipart.
Claude Jones, Director of Engineer, @Walmartlabs, USA


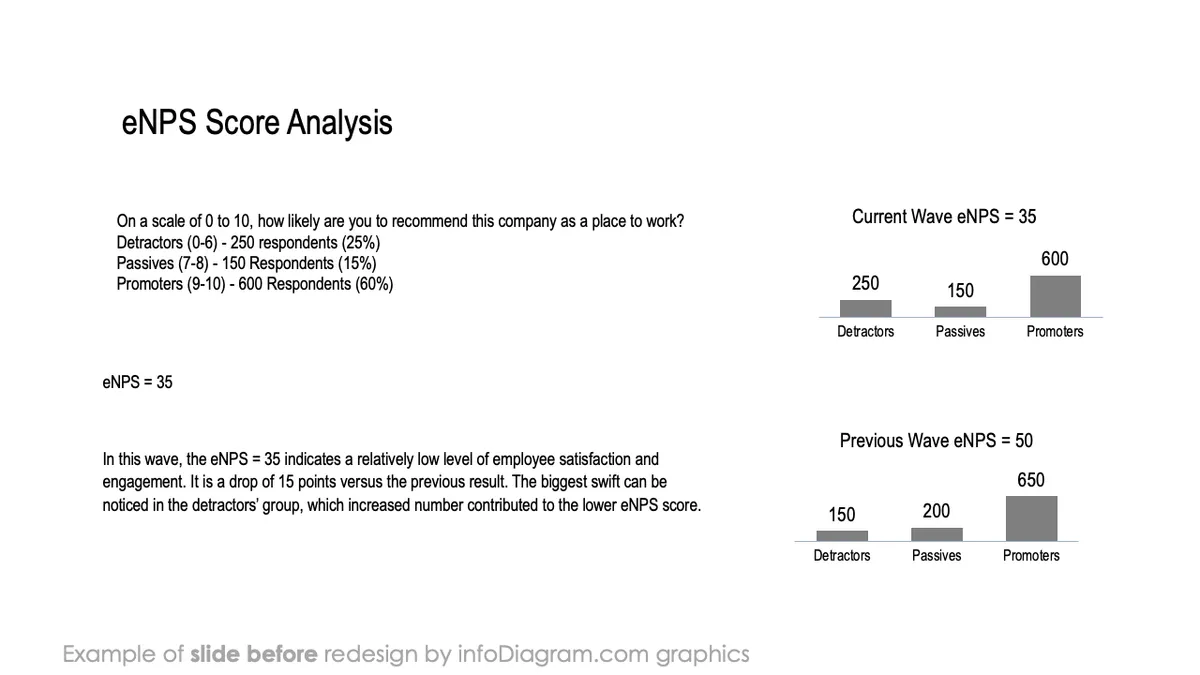
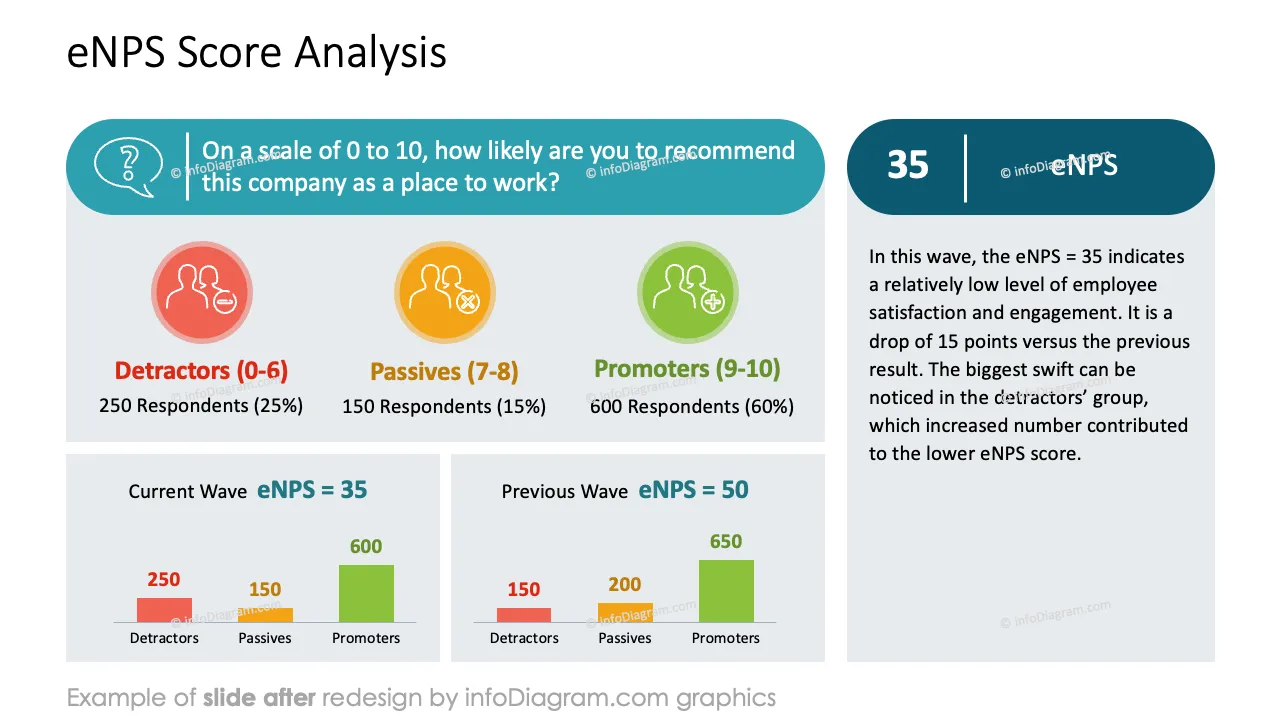
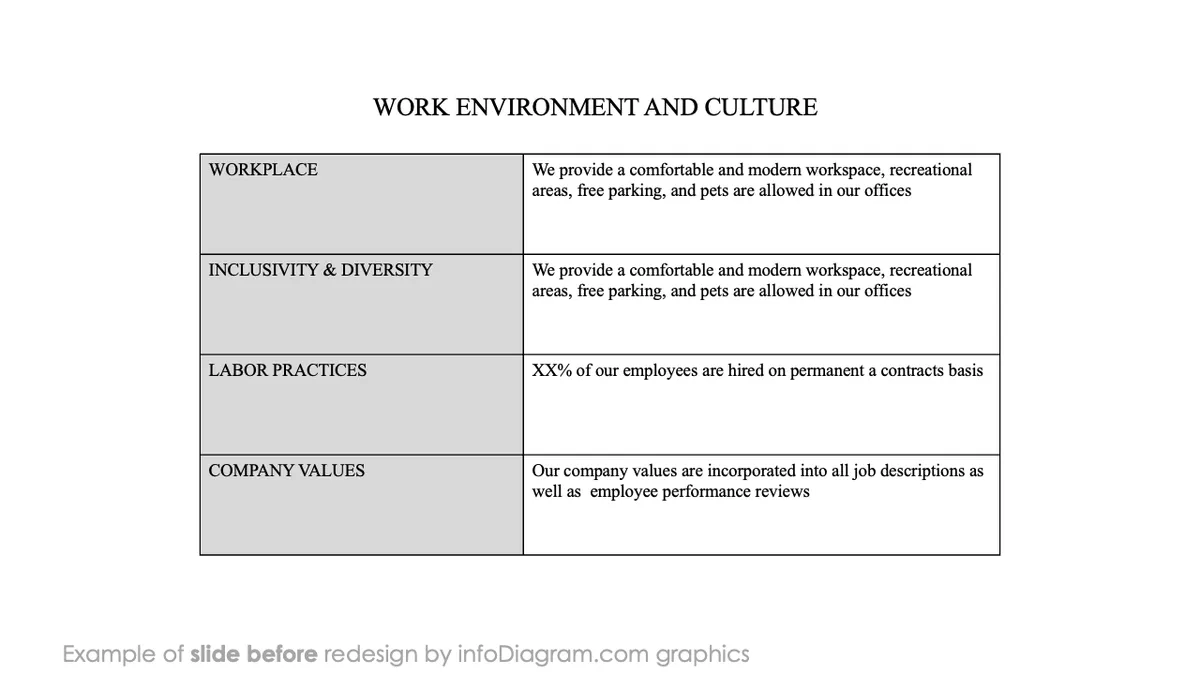
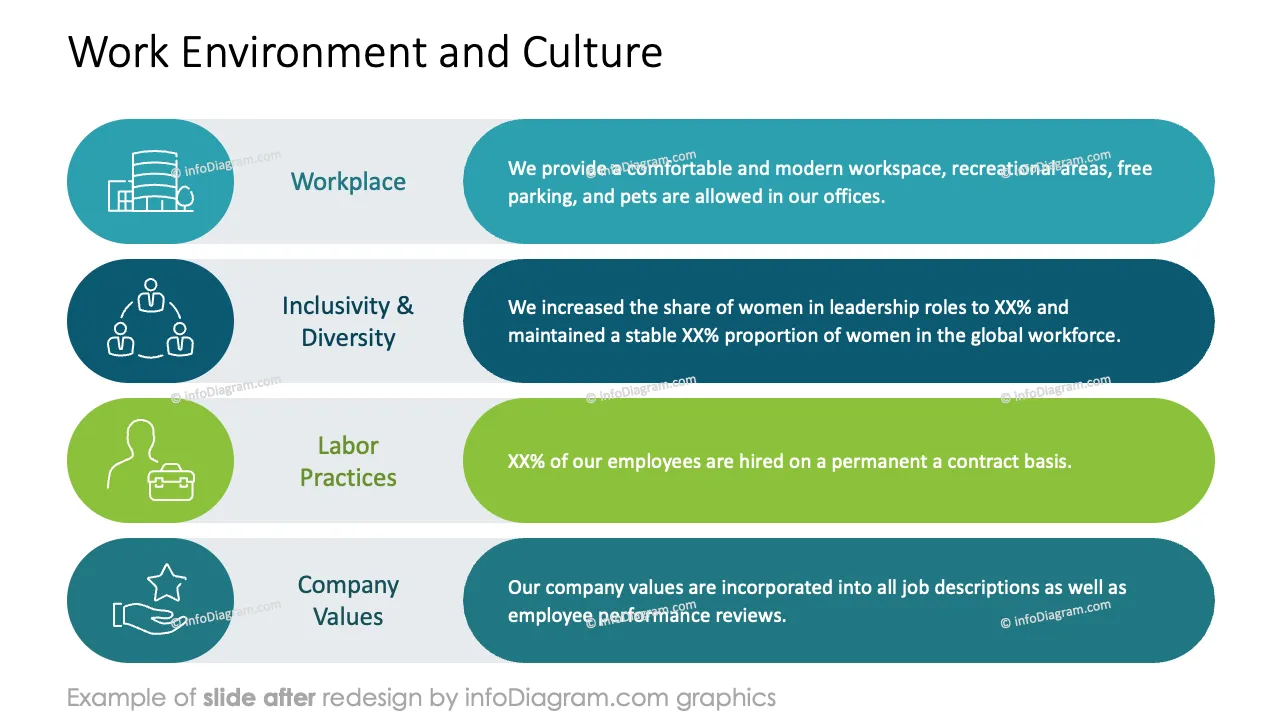
Before and after
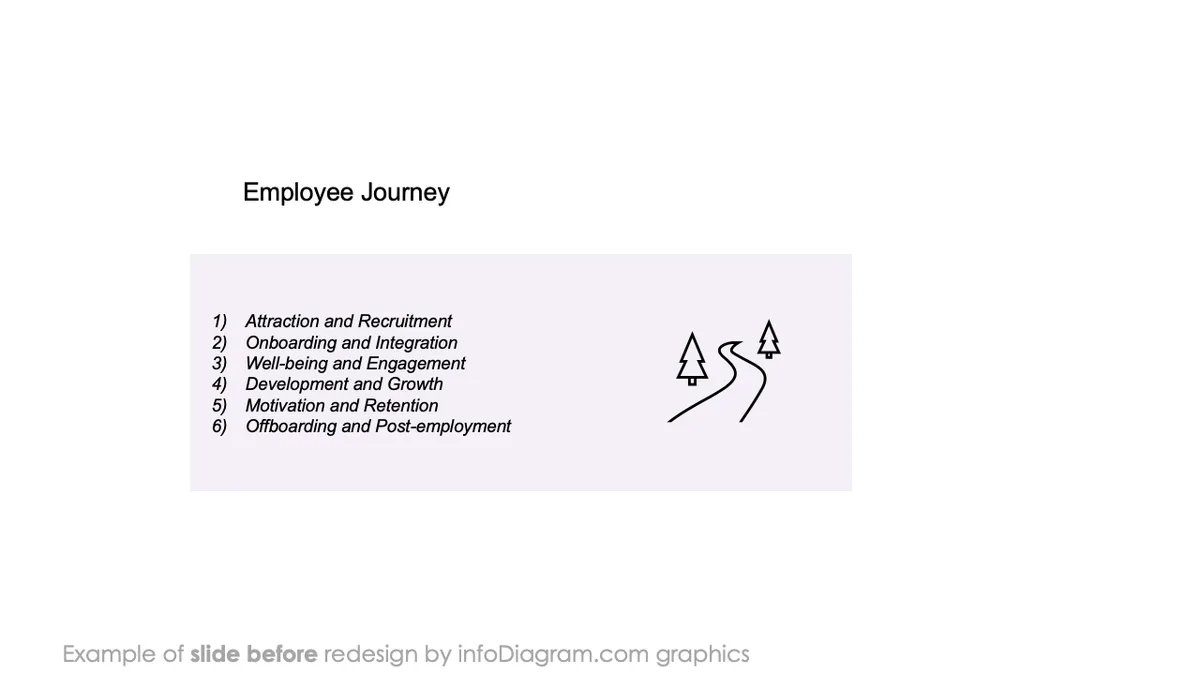
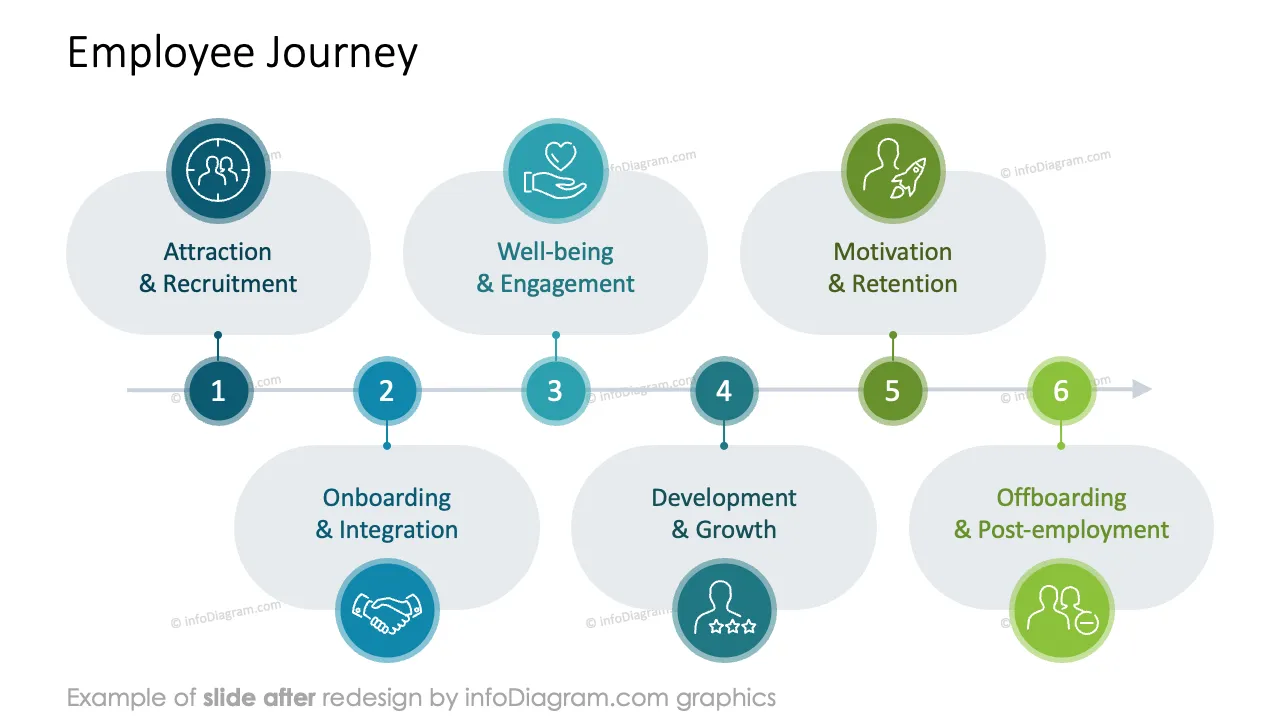
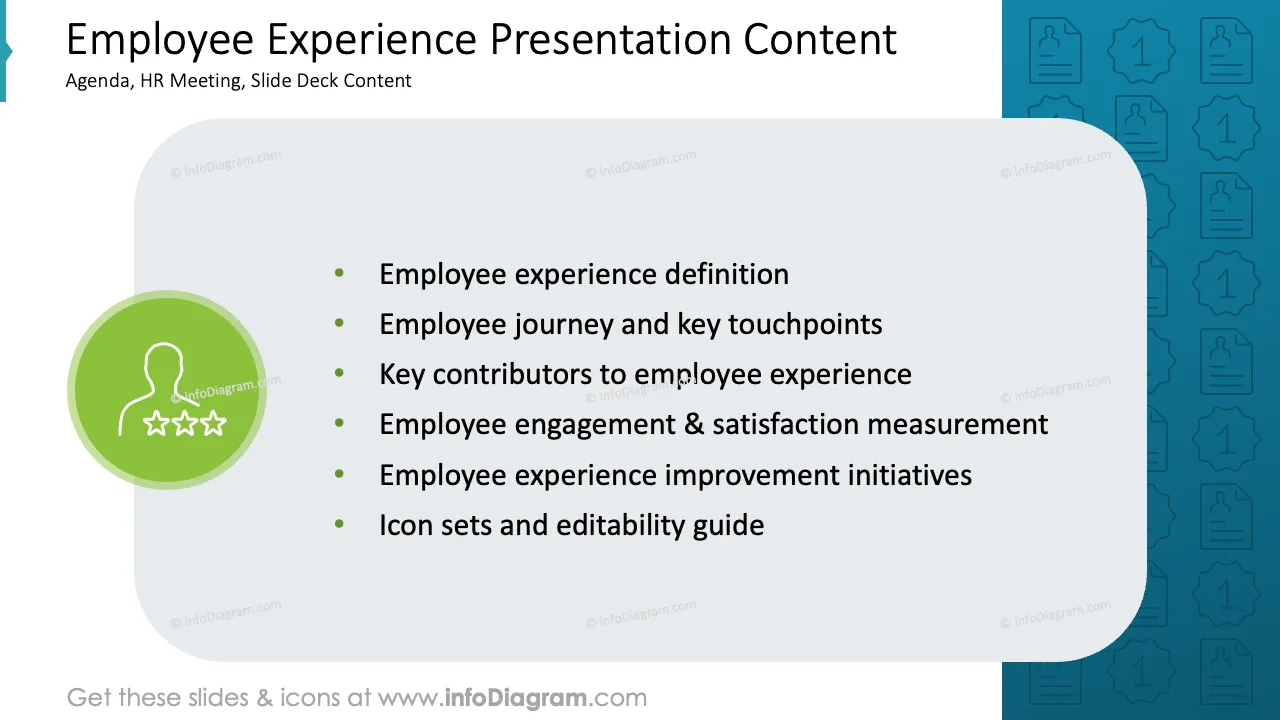
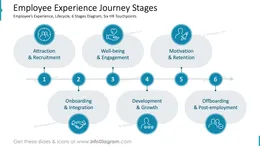
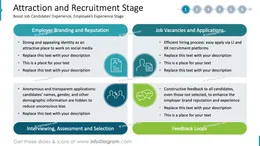
Do you need to present a meaningful and impactful employee experience overview in your company? Use our pre-designed Employee Experience presentation template to show every step of your employees' journey together with the main components shaping the overall satisfaction of your staff.
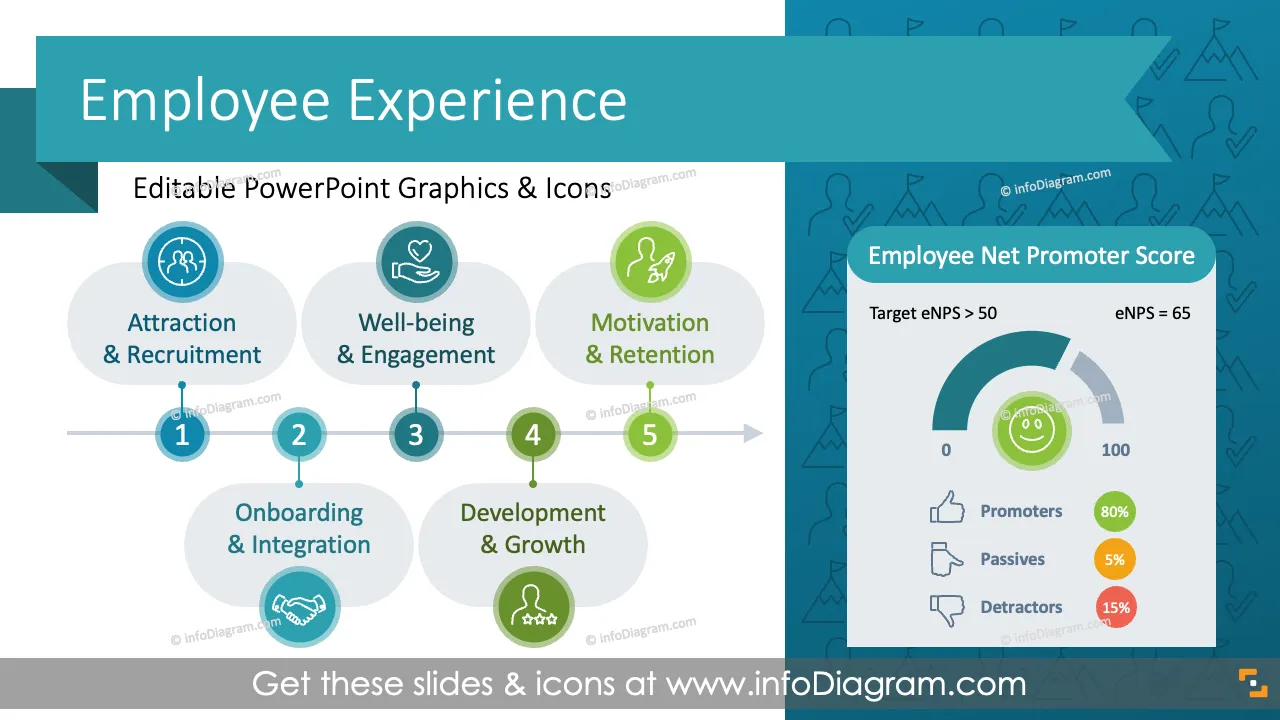
This PowerPoint slide deck is designed in an elegant, flat style with colorful vector illustrations and outline icons. All graphic shapes can be recolored and resized without quality loss.≠
Employee Experience is the total perception and interaction an employee has with their organization. It covers their entire journey, from recruitment to exit. It encompasses the workplace culture, physical environment, technology, and all touchpoints that impact their satisfaction, engagement, and performance.
An Employee Experience presentation can be a powerful tool in various organizational settings to communicate the importance of employee experience, align teams, and drive initiatives.
By incorporating employee satisfaction into various contexts of the company strategy or performance, organizations can communicate their dedication to a positive work environment. This helps to align all stakeholders on the importance of cultivating an engaging and supportive workplace.
We include detailed instructions on how to alter the content, values, colors and look and feel of the charts applied.
Using infographics and chart graphs can help you organize and present an employee experience overview in an engaging and visually appealing format.
Try using those PowerPoint graphics to present your data visually in an elegant way.
All graphics are editable to modify the size, colors, and text. Also, you can extend the collection further with more PPT symbols (see Related Diagrams section).
Try using thisset of fully editable PowerPoint vector shapes to present your data visually in an elegant way. You can easily modify all elements:
Your graphics add a nice touch to my presentations and I recently used them for one of my all-hands meetings. Your toolbox adds professionalism to my slides. Instead of using standard clipart.
Claude Jones, Director of Engineer, @Walmartlabs, USA
I needed a fresh look at some of my slides. I've tried to find a way to create a paintbrush effect, to underline, accentuate, add some color and the handwritten markers were just the things. Very easy to use, easy to size, change the color. It was an affordable, perfect solution and I'm happy to recommend it.
Anonymous, US
The crisp, clean look of the graphics, and the fact that it allowed me to easily edit and change the colors to match the template was my main reason for purchasing them.
Brandie Jenkins, E-learning Developer, USA


You may also need