Your graphics add a nice touch to my presentations and I recently used them for one of my all-hands meetings. Your toolbox adds professionalism to my slides. Instead of using standard clipart.
Claude Jones, Director of Engineer, @Walmartlabs, USA


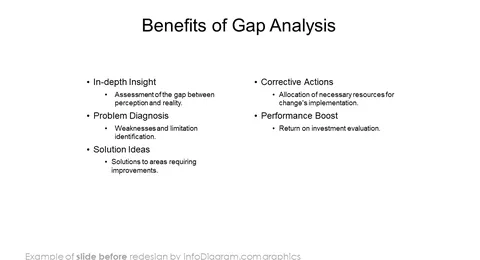
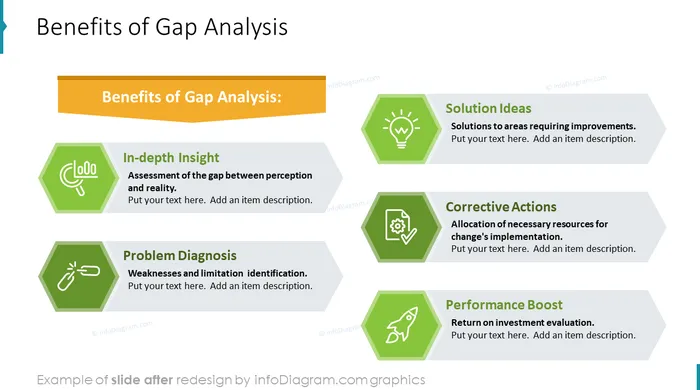
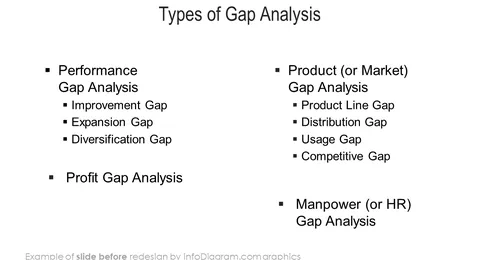
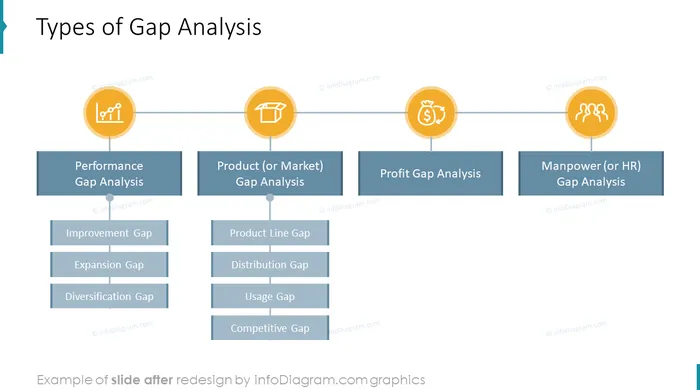
Before and after
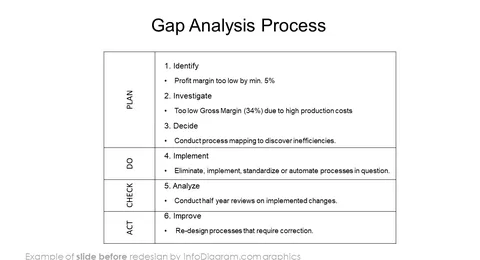
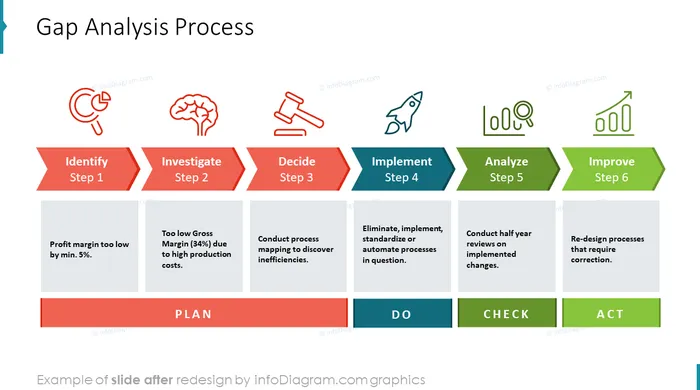
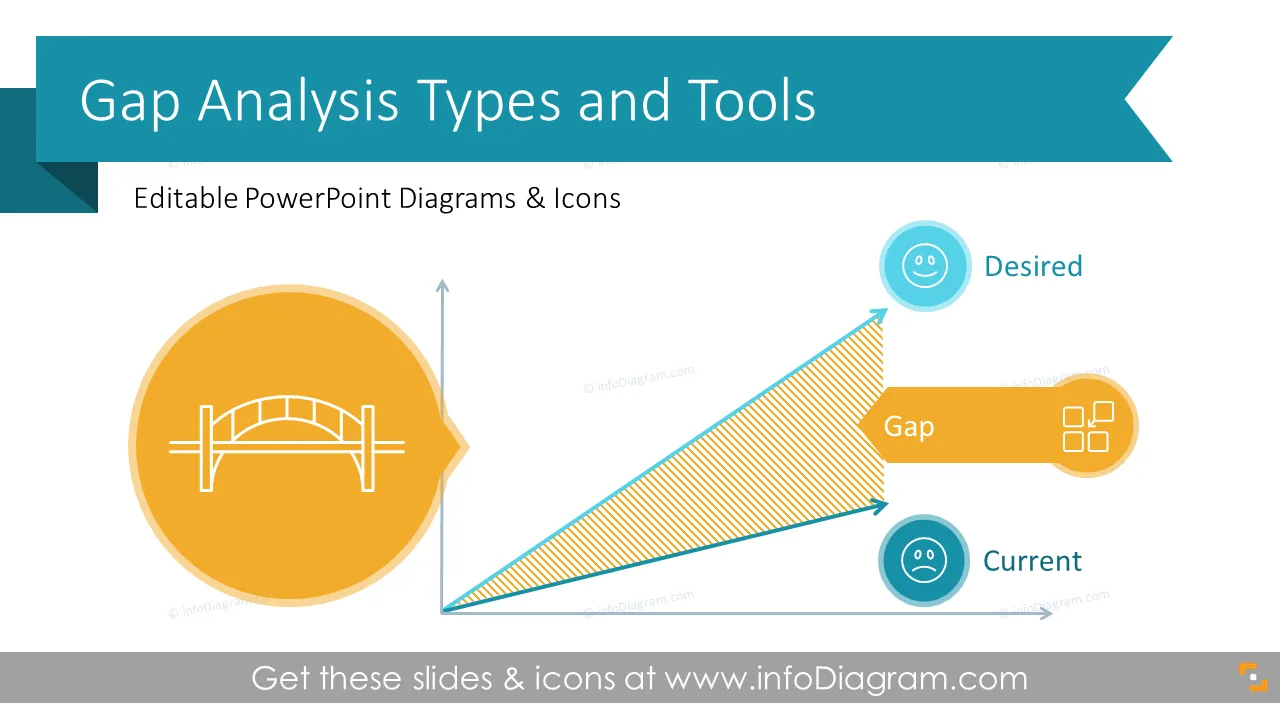
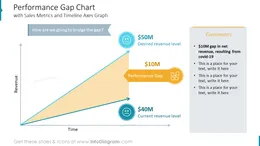
Do you need to show the bridge between the actual and desired performance? Use our compelling gap analysis visualizations, modify numbers, and enrich your slides. Take your presentation to the next level!
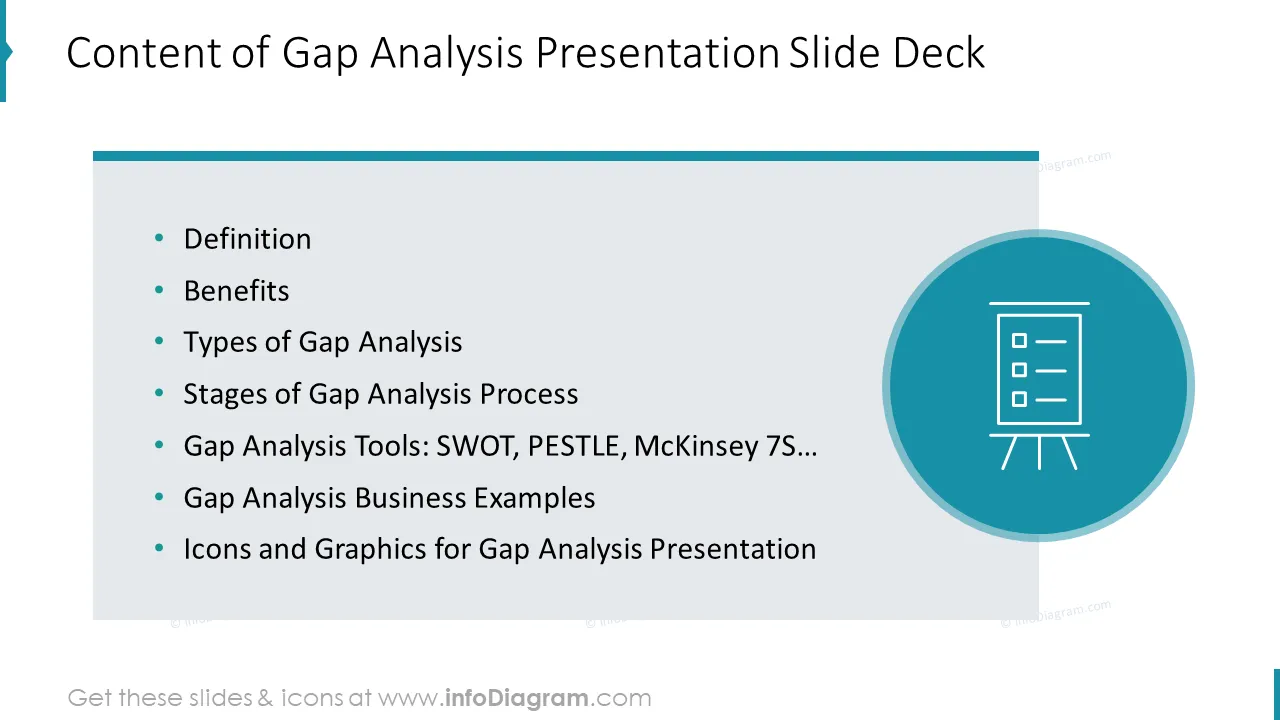
This Gap Analysis Types and Tools PowerPoint Template Presentation contains visual slides with:
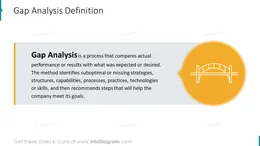
A gap analysis is a process that compares actual performance or results with what was expected or desired. The method provides a way to identify suboptimal or missing strategies, structures, capabilities, processes, practices, technologies, or skills, and then recommends steps that will help the company meet its goals.
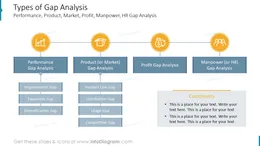
Gap analysis is a business assessment methodology. If you need to evaluate current results and the necessary improvement efforts to close the gap and reach the desired performance, use our completely editable gap analysis PowerPoint template to convey your message. Using creative visuals to illustrate the turnaround process makes the information clear in the mind of the audience. You can pick up from the various examples reflecting typical gap types – performance, product (or market), profit, or manpower. You can reuse our graphs and charts and tailor them to your needs to upgrade your presentation slides. The majority of our charts are Data-Driven Excel Charts, so it is very easy to change the presented values. We also include detailed instructions on how to alter the content, values, colors, and look and feel of the charts.
Using infographics will help you organize information in a good-looking way:
Try using those PowerPoint illustrations to present your content visually in an elegant way.
All graphics are editable, so you can modify the colors and text. We also added a general icon collection at the end of the presentation deck. Optionally you can also extend the collection with more PPT symbols (see Related Diagrams section).
Fully editable in PowerPoint set of vector shapes fully editable with built-in PowerPoint tools, including
To deepen your understanding and skills, we suggest exploring additional materials such as our blog and YouTube video, which are trusted sources dedicated to refining presentation decks:
Your graphics add a nice touch to my presentations and I recently used them for one of my all-hands meetings. Your toolbox adds professionalism to my slides. Instead of using standard clipart.
Claude Jones, Director of Engineer, @Walmartlabs, USA
I needed a fresh look at some of my slides. I've tried to find a way to create a paintbrush effect, to underline, accentuate, add some color and the handwritten markers were just the things. Very easy to use, easy to size, change the color. It was an affordable, perfect solution and I'm happy to recommend it.
Anonymous, US
The crisp, clean look of the graphics, and the fact that it allowed me to easily edit and change the colors to match the template was my main reason for purchasing them.
Brandie Jenkins, E-learning Developer, USA


You may also need