Your graphics add a nice touch to my presentations and I recently used them for one of my all-hands meetings. Your toolbox adds professionalism to my slides. Instead of using standard clipart.
Claude Jones, Director of Engineer, @Walmartlabs, USA
Your graphics add a nice touch to my presentations and I recently used them for one of my all-hands meetings. Your toolbox adds professionalism to my slides. Instead of using standard clipart.
Claude Jones, Director of Engineer, @Walmartlabs, USA
I needed a fresh look at some of my slides. I've tried to find a way to create a paintbrush effect, to underline, accentuate, add some color and the handwritten markers were just the things. Very easy to use, easy to size, change the color. It was an affordable, perfect solution and I'm happy to recommend it.
Anonymous, US
The crisp, clean look of the graphics, and the fact that it allowed me to easily edit and change the colors to match the template was my main reason for purchasing them.
Brandie Jenkins, E-learning Developer, USA
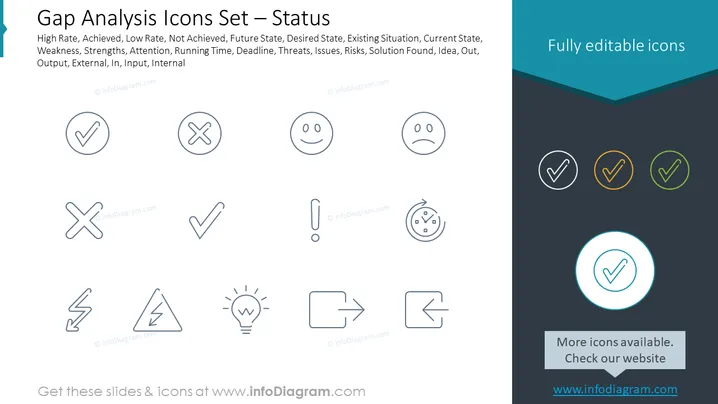
The PowerPoint slide titled "Gap Analysis Icons Set — Status" features a collection of icons representing various elements related to gap analysis such as "High Rate," "Achieved," "Low Rate," "Not Achieved," and other terms including "Future State," "Desired State," "Existing Situation," "Strengths," "Weakness," and concepts like "Attention," "Deadline," "Threats," "Issues," "Risks," and "Solution Found." Each term beside an icon suggests how that symbol might be used to visually represent the corresponding concept in a gap analysis context, helping to communicate status assessments quickly and effectively.
The slide carries a very minimalistic aesthetic with flat design icons, using color highlights selectively to draw attention to specific elements. The clean lines and organized layout give the slide a professional and modern look.


