Pros and Cons Comparison Chart Template Package includes:
- 15+ modern comparison charts with various backgrounds and iconography for PowerPoint and Google Slides.
- Three graphical styles to choose from: Impactful flat design infographics, light, and elegant outlines, or creative hand-drawn shapes and icons.
- 49 vector icons of the comparison concept: Permission / Rejection, Advantage / Disadvantage, Positive / Negative. We have also added business icons of cooperation, Globe, growth, decrease, drained and charged battery, lock, hourglass, ordinance, presentation board, happy/unhappy smiley face, and scales symbols.
- Instructions on how to customize differences and comparison visuals using editing tools.
Format: Fully editable vector shapes and fonts (you can recolor comparison infographic diagrams and icons, and resize them without quality loss).
We have designed several modern templates and formats to make comparisons so you can present both sides' arguments.
How to Use Pros and Cons Comparison Chart Templates to Create a Product Comparison Chart, Software Comparison Chart, Feature Comparison Chart, or a Price Comparison Chart in PPT or PDF Format?
Simply choose a template and customize your comparison with sets of data like differences between two prospects, similarities, and differences between two products, or advantages and disadvantages of different strategies to make the comparison. You can quickly and easily use these visually appealing slide templates and charts to compare two or more items.
The package has multiple comparison chart designs, lists, icons, and images that you can fully edit and customize with a couple of clicks! Depending on the template designs you choose, list the arguments on the designated rows and columns of the presentation template to make professional pros and cons comparison charts. If you want to use a comparison chart as a portable document, save the chart as a PDF file with your preferred presentation software or use similar software solutions to convert the file.
Some ideas to create comparison presentations with the templates:
- Show pluses/minuses, and customize the icons to use them as a standard cost comparison chart template or a price comparison chart template.
- Create a comparison between the gains and losses of a proposal in the decision-making process.
- Visualize the benefits and drawbacks of the solution you want to buy or sell.
- List the advantages versus disadvantages of an application.
- Present a visual comparison of ups and downs on one slide.
- Point out different options and create the best comparison charts that suit your needs.
When Should I Use a List Comparison Template Instead of a Pie Chart, Bar Chart, or a Comparison Matrix?
For people who want to buy a product, It is easier to understand simple comparison lists over complicated data charts. It is recommended to use this slide deck if you need to prepare comparison charts to use as a way to compare prices, products, strategies, individuals, and companies for an easier subject or a less sophisticated audience. If you need a way to compare and contrast differences with numerous elements like different sets of data, or if you need to compare concepts with multiple dimensions, you should probably check out our other PowerPoint templates with more complex charts.
Why is it important to visualize Comparison?
Visualizing comparisons between two items is vital because it makes understanding and decision-making much easier. While describing things in words can be helpful, using visuals gives people a clearer and quicker grasp of the situation. When you show comparisons visually, you provide a clear picture that helps viewers see the similarities and differences more clearly. This not only makes the information easier to remember but also makes communication more effective. Whether you're comparing products, strategies, or data, using visual representations helps everyone involved understand the situation better and make smarter decisions.
Detailed Element Description:
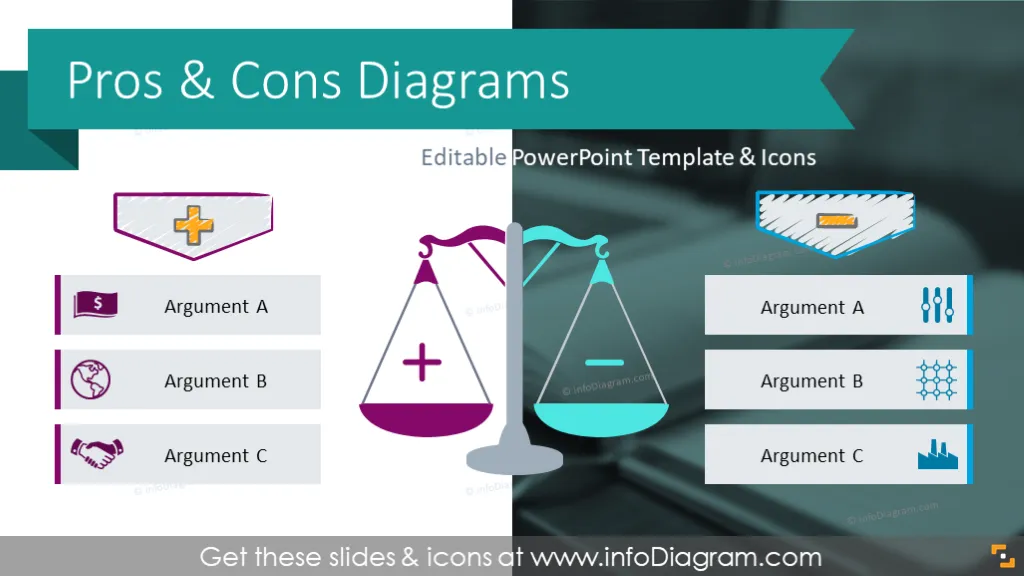
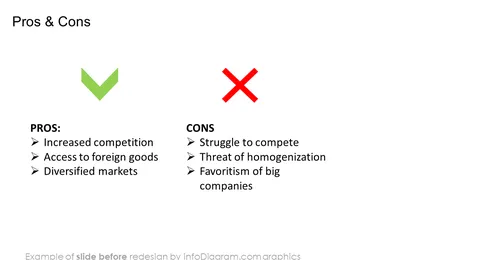
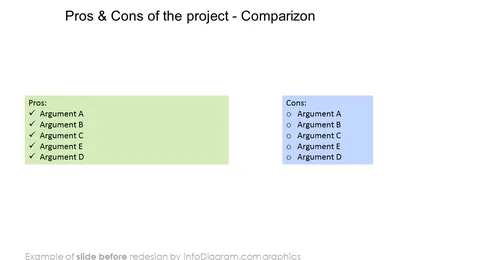
- Pros and cons comparison template: 2 Colored lists with comparisons, fonts, formats, diagrams, and icons for you to freely customize.
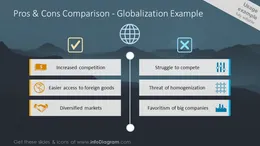
- Globalization chart for comparison process illustrated with two lists on a picture background.
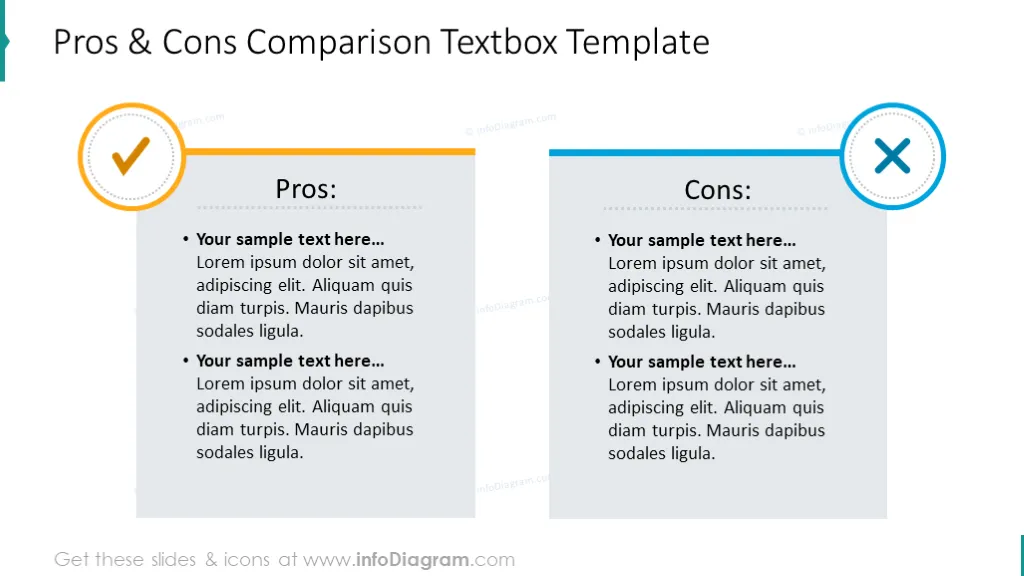
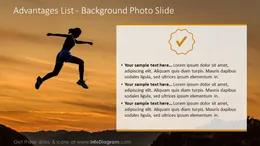
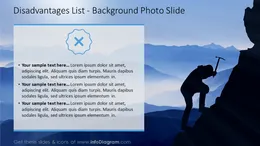
- Blank comparison chart for advantages and disadvantages in 3 versions: With a photo background and a simple textbox, a semicircle chart layout and a place for explaining the arguments, template with pictures.
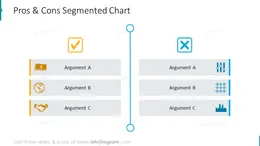
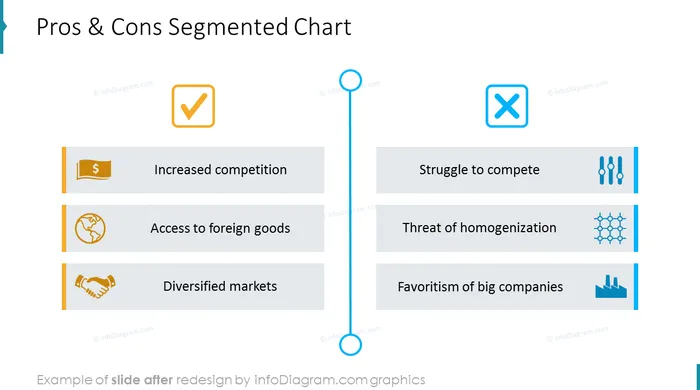
- Segmented chart template with 3 textboxes to plan comparisons.
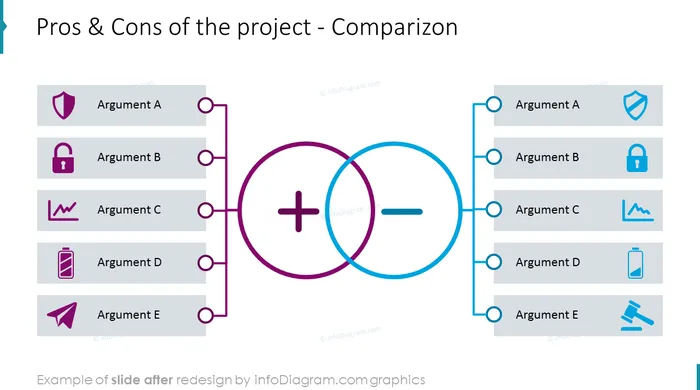
- Plus and minuses comparison slide presented with Venn chart and text description with icons. The template is in two versions: on dark and light backgrounds.
- Ups and downs sample comparison chart: With hourglass diagram and a place for a text; swim diagram with icons and short description.
- Balance scale with pros and cons comparison lists.
- Comparison charts with editable text boxes.
- Benefits and drawbacks analysis illustrated with a diagonally divided slide with text description and outline symbols.
Fully editable set of vector shapes. You can:
- Change the color of all shapes and their outline, including icons.
- Add shadows.
- Change shape and size, rotate, and flip the object.
- Put shapes behind or on top of the text.
Authors
- Design by infoDiagram's designer.
Contact: here