Your graphics add a nice touch to my presentations and I recently used them for one of my all-hands meetings. Your toolbox adds professionalism to my slides. Instead of using standard clipart.
Claude Jones, Director of Engineer, @Walmartlabs, USA
Your graphics add a nice touch to my presentations and I recently used them for one of my all-hands meetings. Your toolbox adds professionalism to my slides. Instead of using standard clipart.
Claude Jones, Director of Engineer, @Walmartlabs, USA
I needed a fresh look at some of my slides. I've tried to find a way to create a paintbrush effect, to underline, accentuate, add some color and the handwritten markers were just the things. Very easy to use, easy to size, change the color. It was an affordable, perfect solution and I'm happy to recommend it.
Anonymous, US
The crisp, clean look of the graphics, and the fact that it allowed me to easily edit and change the colors to match the template was my main reason for purchasing them.
Brandie Jenkins, E-learning Developer, USA
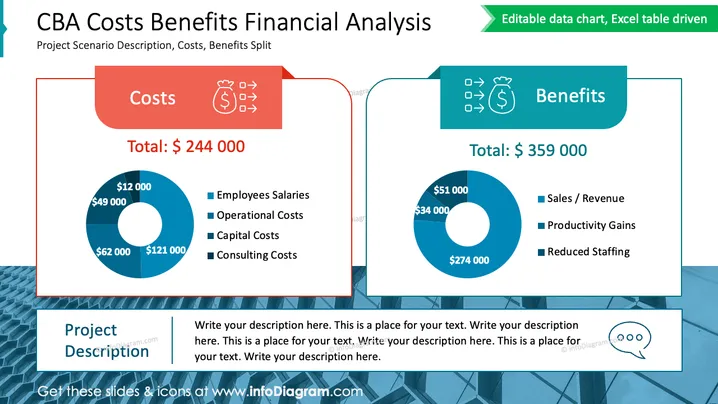
The slide titled "CBA Costs Benefits Financial Analysis" features a comparison between costs and benefits of a project. On the left side, costs are totaled at $244,000 and broken down into employee salaries ($49,000), operational costs ($62,000), capital costs ($121,000), and consulting costs ($12,000). The right side lists benefits totaling $359,000, categorized as sales/revenue ($274,000), productivity gains ($34,000), and reduced staffing ($51,000). A separate space is provided at the bottom left for a project description.
The overall look of the slide is clean and corporate, with a contrasting color scheme that effectively distinguishes between costs and benefits. The use of donut charts simplifies the financial data presentation, making it immediately accessible to the viewer.


