Your graphics add a nice touch to my presentations and I recently used them for one of my all-hands meetings. Your toolbox adds professionalism to my slides. Instead of using standard clipart.
Claude Jones, Director of Engineer, @Walmartlabs, USA
Your graphics add a nice touch to my presentations and I recently used them for one of my all-hands meetings. Your toolbox adds professionalism to my slides. Instead of using standard clipart.
Claude Jones, Director of Engineer, @Walmartlabs, USA
I needed a fresh look at some of my slides. I've tried to find a way to create a paintbrush effect, to underline, accentuate, add some color and the handwritten markers were just the things. Very easy to use, easy to size, change the color. It was an affordable, perfect solution and I'm happy to recommend it.
Anonymous, US
The crisp, clean look of the graphics, and the fact that it allowed me to easily edit and change the colors to match the template was my main reason for purchasing them.
Brandie Jenkins, E-learning Developer, USA
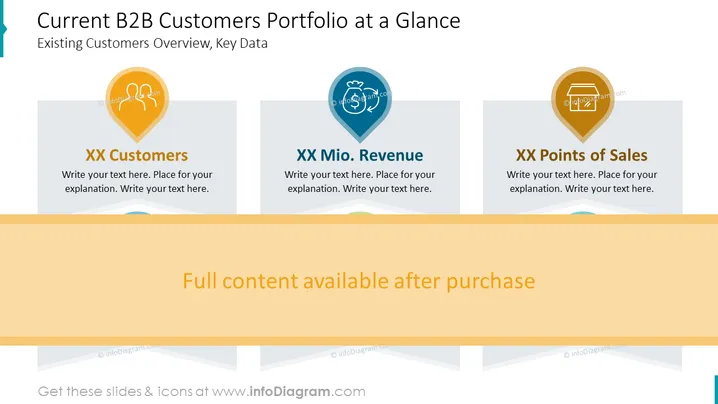
This slide titled ‘Current B2B Customers Portfolio at a Glance’ presents an overview of key data on existing B2B customers. It features three main sections, each with a placeholder 'XX' to input specific data. The first is labeled 'XX Customers', which likely represents the current number of customers—this provides viewers with insight into the customer base size. Next, 'XX Mio. Revenue' indicates a space to state the revenue generated from these customers, reflecting the financial contribution of the client portfolio. The last section 'XX Points of Sales' implies a count of sales locations, offering a sense of the market presence or the breadth of sales channel distribution.
The overall look of the slide is professional and straightforward, with a clear emphasis on presenting quantifiable data about business customers. The iconography is thematic and intuitively matches the text descriptions, enabling immediate understanding of the metrics presented.


