Your graphics add a nice touch to my presentations and I recently used them for one of my all-hands meetings. Your toolbox adds professionalism to my slides. Instead of using standard clipart.
Claude Jones, Director of Engineer, @Walmartlabs, USA
Your graphics add a nice touch to my presentations and I recently used them for one of my all-hands meetings. Your toolbox adds professionalism to my slides. Instead of using standard clipart.
Claude Jones, Director of Engineer, @Walmartlabs, USA
I needed a fresh look at some of my slides. I've tried to find a way to create a paintbrush effect, to underline, accentuate, add some color and the handwritten markers were just the things. Very easy to use, easy to size, change the color. It was an affordable, perfect solution and I'm happy to recommend it.
Anonymous, US
The crisp, clean look of the graphics, and the fact that it allowed me to easily edit and change the colors to match the template was my main reason for purchasing them.
Brandie Jenkins, E-learning Developer, USA
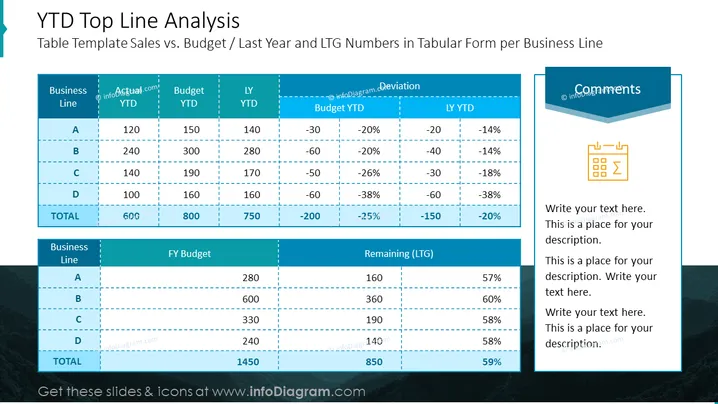
Table Template Sales vs. Budget / Last Year and LTG Numbers in Tabular Form per Business Line
The slide titled "YTD Top Line Analysis" presents a performance comparison that includes a data table juxtaposing Year-To-Date (YTD) actuals against budgets and last year's figures, along with deviations for a fictional company's business lines. "YTD" provides a look at the current year's financial results up to the present date, offering insight into current performance. "Budget" reflects the planned or targeted financial figures for the current year, serving as a benchmark for evaluating actual performance. "LY YTD" represents the actual financial data from the same period in the previous year, giving a historical context for comparison. "Deviation" indicates the variance between actual and budgeted figures, or actual and last year’s numbers, showing where performance is over or under expectations. A section for "Comments" is available for explanatory notes or additional insights into the data displayed.
The slide is divided into three sections with text and tables against a light background and a deep blue header with white text.
The main section contains two tables that list data for Year-To-Date (YTD) actuals, budgets, and deviations of different business lines (A, B, C, D).
The tables are constructed with dotted lines separating the rows and columns, with column headers shaded in blue with white text.
The first table highlights financial data comparing current YTD actuals with YTD budget and last year's YTD figures, along with the percentage deviation.
The second table focuses on the full-year budget alongside the remaining Long-Term Goals (LTG) and the percentage remaining.
The right-hand section of the slide includes a blue, stylized comments text box with an icon resembling a calculator document.
The slide uses contrasting shades of blue for visual emphasis and white for legibility, ## Use Cases
Presenting financial performance in business meetings, to facilitate discussions on budget adherence and financial forecasting.
Using this slide in quarterly business reviews for stakeholders to understand the development of sales vs. planned targets.
Incorporating the slide into investor presentations to provide transparency on financial achievements and expectations.
Utilizing in internal strategy sessions to pinpoint areas needing attention based on year-to-date performance.


